• Home
  • About
    • About Us
    • Board Minutes
    • Job Opportunities
  • Funding
    • GROW-PWCP Enhancement & Protection Program
    • Abandoned Well Sealing Rebate Program
    • Tree Planter & Mulch Applicator Rental Program
  • IWMP
  • Research & Monitoring
    • Surface Water Quality >
      • Waterway Sampling
      • LWF Community Based Monitoring Network
      • Benthic Invertebrate Sampling
    • Groundwater Quality
    • Stormwater Quality
    • Publications
  • Mapping
    • Culvert Inventory Data
    • LiDAR Data
  • Education
  • More Info
  • Contact
EAST INTERLAKE WATERSHED DISTRICT
  • Home
  • About
    • About Us
    • Board Minutes
    • Job Opportunities
  • Funding
    • GROW-PWCP Enhancement & Protection Program
    • Abandoned Well Sealing Rebate Program
    • Tree Planter & Mulch Applicator Rental Program
  • IWMP
  • Research & Monitoring
    • Surface Water Quality >
      • Waterway Sampling
      • LWF Community Based Monitoring Network
      • Benthic Invertebrate Sampling
    • Groundwater Quality
    • Stormwater Quality
    • Publications
  • Mapping
    • Culvert Inventory Data
    • LiDAR Data
  • Education
  • More Info
  • Contact

Waterway Sampling

The EIWD has been been monitoring the surface water quality in nine different waterways since 2007 with the financial and technical assistance of Manitoba Water Stewardship and the Water Stewardship Fund. The EIWD tests the following waterways quarterly:
  1. Fisher River
  2. Fish Lake Drain
  3. Grassmere Creek
  4. Icelandic River
  5. Netley Creek
  6. Parks Creek
  7. Washow Creek
  8. Wavey Creek
  9. Willow Creek
From the data we have gathered, the EIWD has been able to compile a relative health rating for our streams based on the Water Quality Index (WQI). The WQI analyzes the health of our waterways from 22 water quality parameters to summarize the general health of our watersheds. This index can be used to reflect the overall and ongoing condition of the water, however, the index may not show the effect of random and transient events (such as spills).
View our detailed "Water Quality 14 Year Report".
You can also visualize our water quality results on DataStream.
Picture
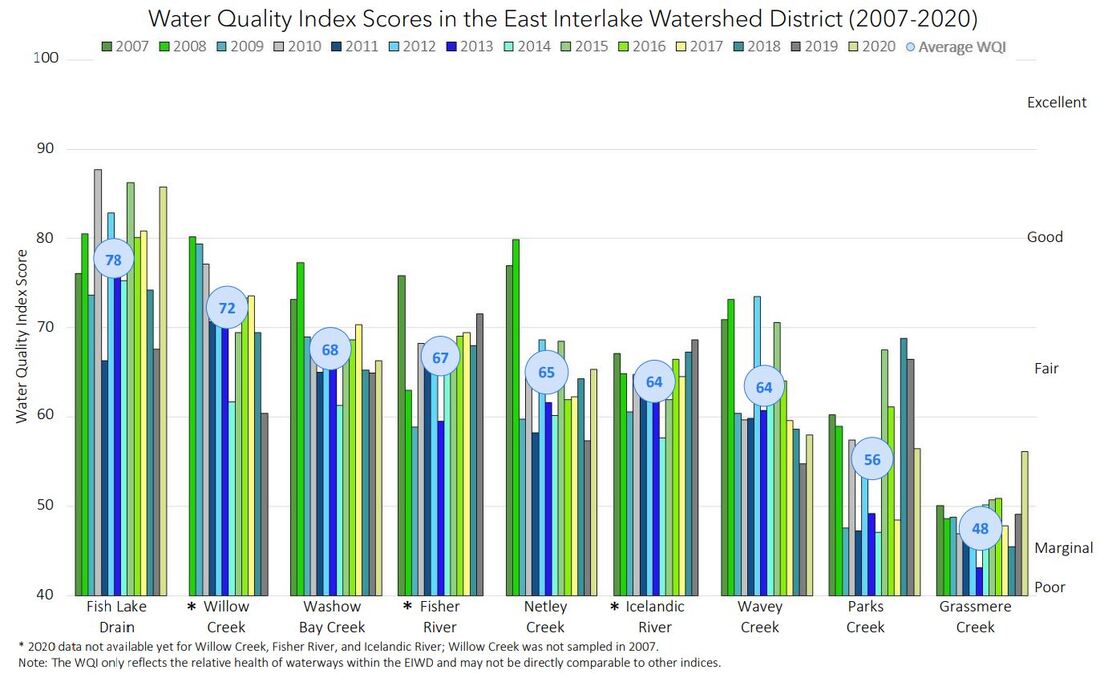
The average WQI rating has been calculated for each waterway over the years (see graph above). WQI rating can be divided into the following categories:
  • Excellent (95-100)
    • water quality is protected with a virtual absence of threat or impairment
    • conditions very close to natural or pristine levels.
  • Good (80-94)
    • water quality is protected with only a minor degree of threat of impairment
    • conditions rarely depart from natural or desirable levels.
  • Fair (65-79)
    • water quality is usually protected but occasionally threatened or impaired
    • conditions sometimes depart from natural or desirable levels.
  • Marginal (45-64)
    • water quality is frequently threatened or impaired
    • conditions often depart from natural or desirable levels.
  • Poor (0-44)
    • water quality is almost always threatened or impaired
    • conditions usually depart from natural or desirable levels
​
Note: The above rating system is taken from the Canadian Water Quality Guidelines for the Protection of Aquatic Life. For more information on the WQI please click HERE.
(204) ​642-7578  • Info@EastInterlake.ca • 74 1st Avenue • Gimli, MB • R0C 1B0
Powered by Create your own unique website with customizable templates.
  • Home
  • About
    • About Us
    • Board Minutes
    • Job Opportunities
  • Funding
    • GROW-PWCP Enhancement & Protection Program
    • Abandoned Well Sealing Rebate Program
    • Tree Planter & Mulch Applicator Rental Program
  • IWMP
  • Research & Monitoring
    • Surface Water Quality >
      • Waterway Sampling
      • LWF Community Based Monitoring Network
      • Benthic Invertebrate Sampling
    • Groundwater Quality
    • Stormwater Quality
    • Publications
  • Mapping
    • Culvert Inventory Data
    • LiDAR Data
  • Education
  • More Info
  • Contact